3 Uses for Gauge Charts
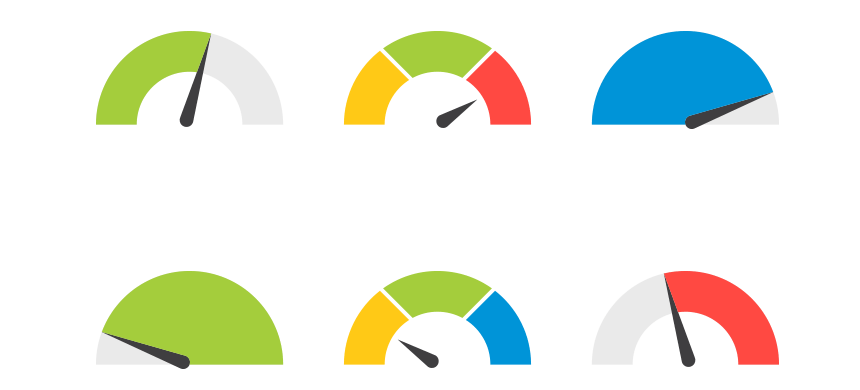
A gauge chart looks like a speedometer, with a needle that moves around a dial. It shows how a particular value compares to a set limit. The needle on the gauge chart moves around a dial to show how the particular value compares to the set limit. Gauge charts are often used to track things … Read more


